
Risk Attribution With Everysk
Introduction
One of the key values provided by intelligent automation is the ability for complex calculation at scale. This blog post examines how capital markets professionals use Everysk to swiftly understand attribution risk across a wide variety of positions and portfolios.
What is risk attribution?
Risk attribution, often referred to as “attribution risk” or “attribute risk” in capital markets, is a pivotal concept that helps dissect the contribution of each security to the overall portfolio risk. A common misconception is that the risk of a portfolio can be determined by merely summing up the individual risks of its securities. However, this approach overlooks the crucial role of correlation.
In capital markets, it’s not just about the “attributable risk” but also about understanding how securities correlate with the entire portfolio. Securities that are highly correlated present a different kind of risk compared to those that are uncorrelated or negatively correlated. The latter, in fact, can act as a hedge, reducing the overall risk.
For those delving into the mathematical side, terms like “attributable risk formula,” and “attributable risk calculation” become essential. These formulas help in quantifying the risk attributes. While the “attributable risk calculator” or tools like it can simplify these calculations, understanding the underlying principles is crucial for capital market professionals.
Marginal Contribution to Total Risk (MCTR) for Capital Markets: A Deeper Dive
In the intricate world of capital markets, the Marginal Contribution to Total Risk (MCTR) stands out as a pivotal measure for risk attribution. This metric, central to the “attributable risk equation,” offers a nuanced understanding of the risk landscape.
At its core, MCTR sheds light on what makes a position riskier in a portfolio. Positions with larger allocations, higher individual volatilities, and more correlation with the portfolio often carry higher risks. This is where the mathematical representation of MCTR becomes invaluable.
The MCTR for a given asset i in a portfolio is expressed as:
Where:
MCTRi represents the marginal contribution to total risk for asset i.
Wi denotes the weight of asset
i in the portfolio.
σP is the total portfolio volatility.
∂σP/∂wi is the partial derivative of the portfolio volatility with respect to the weight of asset i.
This formula provides a clear picture of how a marginal change in the allocation of a particular asset impacts the overall portfolio risk.
Conversely, positions that offer smaller allocations, lower volatilities, and less (or negative) correlation to the rest of the portfolio are deemed less risky. Such positions often align with the principles of “attributable risk percent formula” and “attributable risk percentage formula,” showcasing how much risk they contribute in percentage terms.
By understanding and applying the MCTR formula, capital market professionals can make more informed decisions, ensuring that their portfolio’s risk aligns with their strategic objectives.
Visualizing Risk Attribution Within Everysk: The Power of Tools and Graphics
For capital market professionals, while the formula for determining MCTR remains consistent, its practical application can be challenging due to the vast number of securities across multiple portfolios. This complexity is particularly felt by money managers who need to evaluate risk throughout the day. Recognizing this challenge, many Everysk clients turn to our Risk Attribution Widget. This tool seamlessly simplifies calculations associated with the attributable risk equation.
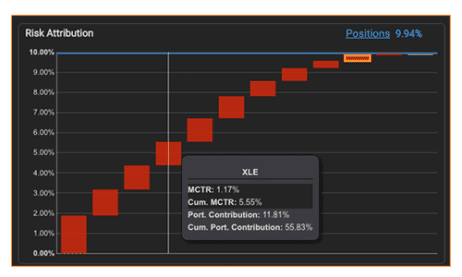
Deployed easily to dashboards within Everysk, theRisk Attribution Widgetvisualizes the marginal contribution to portfolio total risk (MCTR). The x-axis displays various bars, each signifying a distinct source of risk in the portfolio, such as underlying positions, sectors, market capitalization, country of risk, liquidity, or user-defined baskets. The size of these bars (y-axis) indicates their MCTR: red bars represent correlated risks, stacking upwards, while blue bars, stacking downwards, denote uncorrelated risks. These bars are sorted from left to right based on their absolute value.
A notable feature is the blue horizontal line on the widget, representing the forecasted, annualized portfolio volatility. This line is met by the rightmost stacked bar, ensuring a comprehensive visualization of risk.
Hovering over the widget reveals detailed insights:
MCTR: The marginal contribution to annualized portfolio risk from the position.
Cumulative Volatility: A cumulative measure of MCTR, with the rightmost bar indicating total portfolio risk.
Percent: The ratio of a position’s MCTR to the total portfolio risk.
Cumulative Percentage: Cumulatively measures the above, with the rightmost bar representing 100%.
The widget’s stacked bars not only showcase “attributable risk” and “attribute risk” but also provide a vivid representation of each security’s impact on portfolio risk. Tools like the “attributable risk calculator” further enable professionals to swiftly determine the “attributable risk percent” and outcomes of the “attributable risk percentage formula.”
Such visual tools are invaluable, especially when juxtaposing metrics like “attributable risk vs. absolute risk reduction.”
Practical Implications of Risk Attribution for Capital Markets: Guiding Investment Decisions
In the dynamic realm of capital markets, understanding risk is more than a theoretical exercise; it’s about making informed investment decisions.
One of the primary benefits of understanding risk attribution is the ability to identify positions that might be overexposed or underexposed in a portfolio. By leveraging the “attributable risk calculator” and the “attributable risk calculation,” professionals can pinpoint securities that might be contributing too much or too little risk.
Furthermore, the comparison between “attributable risk vs. absolute risk reduction” can offer a clearer perspective on the actual benefits of diversification within a portfolio. This distinction is vital for capital market professionals aiming to strike a balance between potential returns and associated risks.
In essence, risk attribution serves as a compass, guiding capital market professionals in navigating the intricate waters of investment, ensuring that risks align with their strategic objectives.
Beyond the Basics: Advanced Risk Attribution Techniques for Capital Markets
The world of capital markets is ever-evolving, and so are the techniques used to assess and manage risk. While the attributable risk formula provides foundational insights, there are advanced methodologies that professionals are turning to for a more nuanced understanding.
Emerging technologies and analytical tools are enhancing traditional methods like the “attributable risk calculator.” These advancements allow for a deeper dive into “risk attributes,” offering a more granular view of portfolio dynamics.
Furthermore, the distinction between “attributable risk vs. absolute risk reduction” is becoming more refined, enabling professionals to make sharper, data-driven decisions. As the landscape of capital markets becomes more complex, tools like Everysk’s Risk Attribution Widget are advancing in tandem, ensuring that professionals remain at the forefront of risk management.


